Additional area statistics
Aside from the separate “most_common” regridder, a more generic statistical reductions are also available.
A demo of this is shown below, based on the Multi-Scale Ultra High Resolution (MUR) Sea Surface Temperature (SST) dataset.
For optimal memory management we want to make use of Dask’s distributed client:
from dask import distributed

c = distributed.Client()
c
Client
Client-b62f5bfe-7b1f-11ef-9929-2c6dc1920356
| Connection method: Cluster object | Cluster type: distributed.LocalCluster |
| Dashboard: http://127.0.0.1:8787/status |
Cluster Info
LocalCluster
726745b8
| Dashboard: http://127.0.0.1:8787/status | Workers: 4 |
| Total threads: 8 | Total memory: 15.33 GiB |
| Status: running | Using processes: True |
Scheduler Info
Scheduler
Scheduler-107d9031-e3cf-4099-a501-efd4988639b9
| Comm: tcp://127.0.0.1:44181 | Workers: 4 |
| Dashboard: http://127.0.0.1:8787/status | Total threads: 8 |
| Started: Just now | Total memory: 15.33 GiB |
Workers
Worker: 0
| Comm: tcp://127.0.0.1:38217 | Total threads: 2 |
| Dashboard: http://127.0.0.1:46731/status | Memory: 3.83 GiB |
| Nanny: tcp://127.0.0.1:38577 | |
| Local directory: /tmp/dask-scratch-space/worker-4hf6p93c | |
Worker: 1
| Comm: tcp://127.0.0.1:45173 | Total threads: 2 |
| Dashboard: http://127.0.0.1:43307/status | Memory: 3.83 GiB |
| Nanny: tcp://127.0.0.1:34411 | |
| Local directory: /tmp/dask-scratch-space/worker-jf1bw94t | |
Worker: 2
| Comm: tcp://127.0.0.1:42501 | Total threads: 2 |
| Dashboard: http://127.0.0.1:42529/status | Memory: 3.83 GiB |
| Nanny: tcp://127.0.0.1:45997 | |
| Local directory: /tmp/dask-scratch-space/worker-i6afahfk | |
Worker: 3
| Comm: tcp://127.0.0.1:46337 | Total threads: 2 |
| Dashboard: http://127.0.0.1:35121/status | Memory: 3.83 GiB |
| Nanny: tcp://127.0.0.1:43541 | |
| Local directory: /tmp/dask-scratch-space/worker-yqipft_l | |
The original dataset is of a very high resolution. We will focus on a smaller slice of the globe, and display the original data for reference:
import xarray as xr
import xarray_regrid

sst = xr.open_zarr("https://mur-sst.s3.us-west-2.amazonaws.com/zarr-v1")["analysed_sst"]

# Reduce size of array by only selecting a slice
sst = sst.sel(lat=slice(30, 45), lon=slice(125, 150)).isel(time=0)

sst.plot()
<matplotlib.collections.QuadMesh at 0x7fdc44319b80>

To regrid we define a new target grid, with a lower resolution.
target = xarray_regrid.Grid(
    north=45,
    south=30,
    west=125,
    east=150,
    resolution_lat=1,
    resolution_lon=1,
).create_regridding_dataset(lat_name="lat", lon_name="lon")
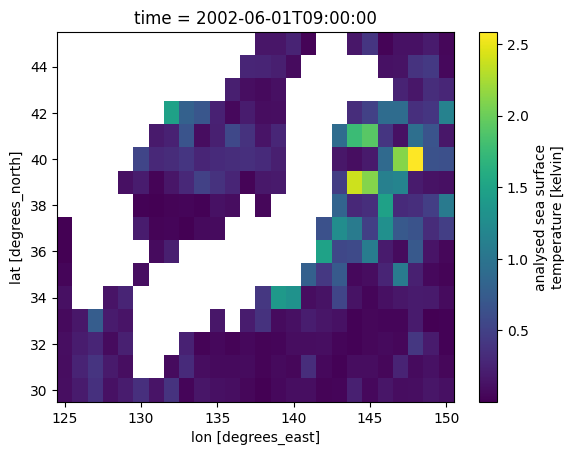
We will take the variance of the data. Note that this operation is lazy when the data consists of dask arrays.
sst_var = sst.regrid.stat(target, method="var", time_dim="time", skipna=False)
When we plot the DataArray, the data is retrieved and the result computed.
Other methods are available, such as “sum”, “mean”, “std”, “median”, “min”, and “max”.
sst_var.plot()
/home/bart/micromamba/envs/xarray_regrid_3.12/lib/python3.12/site-packages/distributed/client.py:3358: UserWarning: Sending large graph of size 28.65 MiB.
This may cause some slowdown.
Consider loading the data with Dask directly
 or using futures or delayed objects to embed the data into the graph without repetition.
See also https://docs.dask.org/en/stable/best-practices.html#load-data-with-dask for more information.
  warnings.warn(
<matplotlib.collections.QuadMesh at 0x7fdc32f05850>